We Put Our Own Feed Under the Microscope. The Results Weren't Pretty.

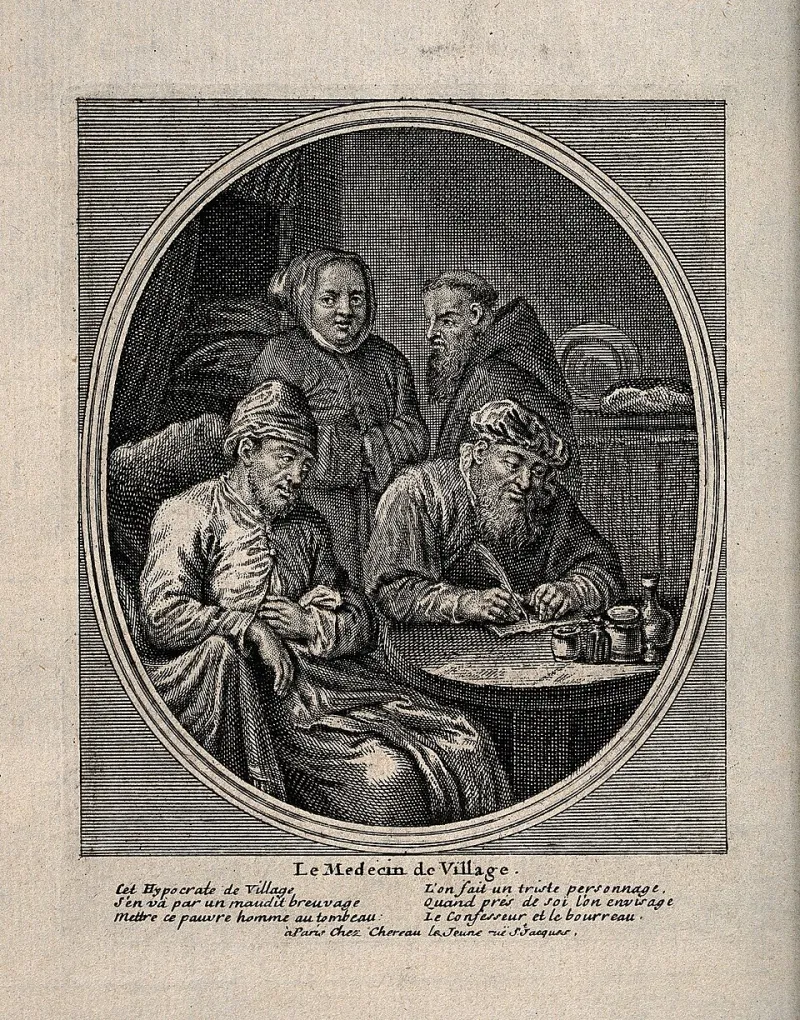
Photo: Shixart1985, CC BY 2.0, via Wikimedia Commons
There's a particular kind of dread that comes with pointing the stethoscope at yourself.
We spend our working lives diagnosing other brands' social media. We've told grown marketing directors, politely, that their Instagram is on life support. We've prescribed content calendars the way a GP prescribes statins. And yet, when we decided to run our own audit framework on our own channels, there was a moment — somewhere around 'post frequency' — where we all went very quiet.
This is the full, unedited write-up. Warts, dead metrics and all.
Why We Volunteered for Our Own Medicine
Two reasons. First, credibility. You wouldn't take fitness advice from a personal trainer wheezing up the stairs, and you shouldn't take audit advice from an agency whose own feed hasn't been checked since the last bank holiday.
Second, curiosity. We genuinely didn't know what we'd find. Agencies are terrible patients. We know just enough about everything to rationalise our bad habits with strategy-sounding language.
Vital Sign One: Posting Frequency — Diagnosis: Arrhythmic
Our framework asks brands to plot their posting pattern over eight weeks. Ours looked like a heart monitor during a horror film: three posts in one week, then silence for a fortnight, then a burst of activity whenever someone remembered LinkedIn exists.
The excuse? Client work. Which is exactly the excuse we'd refuse to accept from a client. If a bakery told us they were 'too busy baking to post about bread', we'd suggest their marketing was eating itself.
Prescription: Batch scheduling, two weeks ahead, non-negotiable.
Vital Sign Two: Engagement Rate — Diagnosis: Mildly Anaemic
Our own engagement rate sat comfortably below the benchmark we hold clients to. Not catastrophically — no tubes and machines — but enough that the irony was thick enough to spread on toast.
The culprit, on inspection, was embarrassingly simple: we'd been posting what we found interesting rather than what our audience needed. Industry in-jokes. Agency culture posts. All very charming, all very low-value to the brand owners actually reading.
Prescription: A 60/40 split — sixty percent genuinely useful diagnostic content, forty percent personality. Same as we'd prescribe anyone.
Vital Sign Three: The Comments Section — Diagnosis: Untended Ward
This one stung. Our comment response time averaged eleven hours on a good day. We tell clients that a comment left hanging is a customer left in a waiting room with no magazine and no update.
Eleven hours. We know. We've already had the uncomfortable team meeting.
Prescription: Comments checked at 9am, 1pm and 4pm daily. Named owner each day, rota style, like ward rounds.
Vital Sign Four: Content Variety — Diagnosis: One-Trick Pony
Scroll our grid and you'd find case study, case study, opinion piece, case study. Competent, consistent, and — if we're honest — a bit beige. Nothing wrong with it, nothing memorable either. The social equivalent of a waiting room with beige walls and a poster about flu jabs.
Prescription: One experiment per month. Something we'd green-light for a client but never quite got round to doing ourselves.
The Overall Prognosis
Stable, not thriving. Which, funnily enough, is the most common diagnosis we hand out. Most brands aren't dying on social — they're coasting, coasting is comfortable, and comfort is exactly why problems go unnoticed until they don't.
Running our own audit did three things. It fixed four genuine problems in a week. It gave us a pile of content ideas for the next quarter. And it reminded us precisely why we make clients go through this process — because everyone, including us, is far too close to their own feed to see it clearly.
If your feed's been feeling a bit 'stable, not thriving', maybe it's time for a proper look. We'd be happy to run the checks. We now know from personal experience exactly how useful — and how bruising — the results can be.